Most creators run A/B tests but invalidate results through subtle biases—testing on low-traffic videos, cherry-picking data, or stopping tests too early. These mistakes turn potentially useful signals into noise. This guide identifies the 7 most common biases that skew A/B test results and shows you practical fixes to run clean, trustworthy tests every time.
Table of Contents
- Quick Start
- Why A/B Tests Fail: The Hidden Bias Problem
- Bias #1 — Selection Bias (Wrong Traffic Source)
- Bias #2 — Sample Size Bias (Too Few Clicks)
- Bias #3 — Timing Bias (Early Stopping)
- Bias #4 — Confirmation Bias (Cherry-Picking Metrics)
- Bias #5 — Novelty Bias (Subscriber Preference)
- Bias #6 — Placement Bias (Unequal Visibility)
- Bias #7 — Platform Bias (Cross-Platform Assumptions)
- Checklist: Clean Test Design
- Common Mistakes & Fixes
- FAQs
Category hub: /creator/social
Quick Start
- Run tests only on videos with 1,000+ impressions in 72 hours.
- Wait 48–72 hours minimum; aim for 100+ clicks per variant before analyzing.
- Split traffic evenly—place tracking links side-by-side in descriptions or comments.
- Log all metrics (impressions, clicks, watch time) to avoid cherry-picking winners.
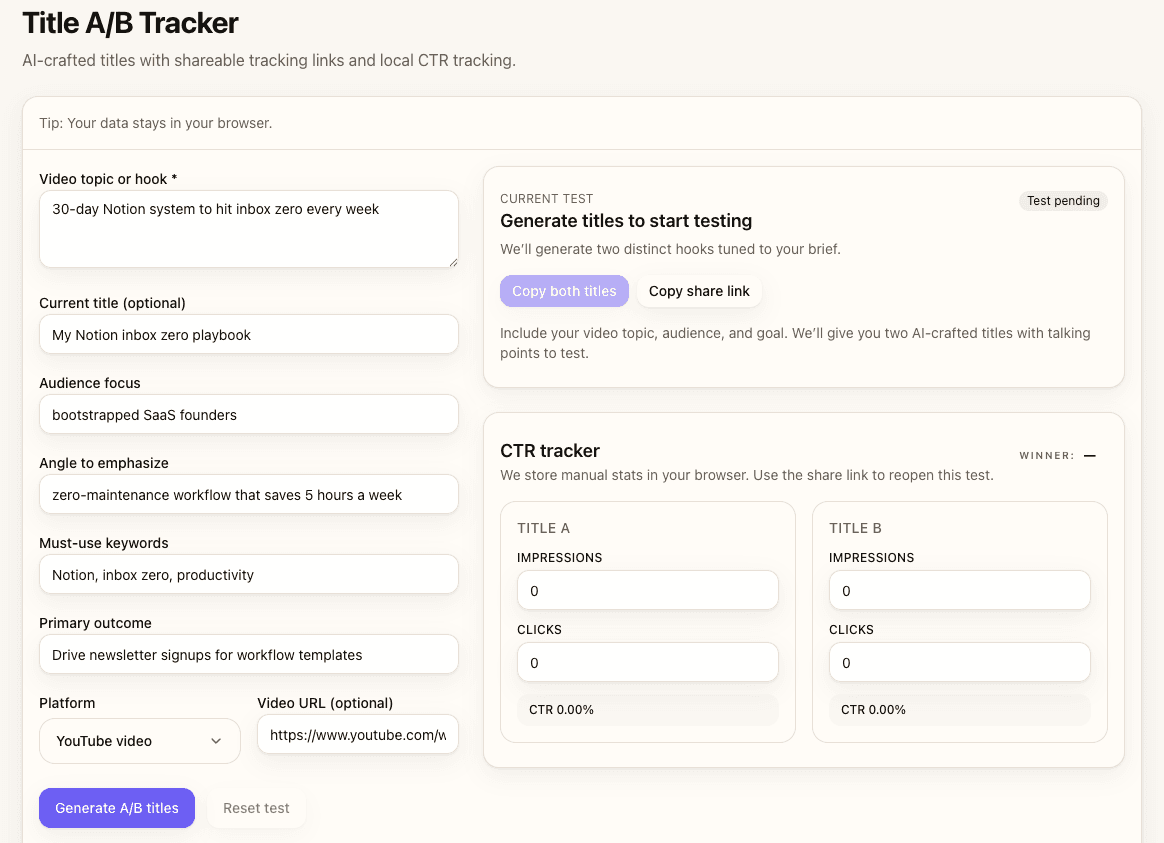
- Use the Title A/B Tracker to check statistical confidence before declaring a winner.
Why A/B Tests Fail: The Hidden Bias Problem
Bias enters at every stage of testing: setup, execution, and analysis. A common mistake: creators test two titles, see Title B win with 12% CTR versus Title A's 8%, and declare victory—without noticing both variants only got 20 clicks total. With that sample size, you're measuring noise, not signal.
Other biases are subtler. Testing on a video with spiking traffic (day 1 subscriber surge) gives different results than testing on stable traffic (day 3+ organic feed). Placing Link A in line 1 of the description and Link B behind "Show more" skews visibility. Stopping after 24 hours misses the organic CTR that settles in days 2–3.
The fix isn't to stop testing—it's to recognize these biases and design around them. Clean tests require thoughtful setup, patience during execution, and discipline in analysis.
Bias #1 — Selection Bias (Wrong Traffic Source)
The problem
Testing on videos with uneven or inconsistent traffic produces unreliable results. New uploads get a subscriber surge in the first 24 hours, then traffic drops or shifts to organic feed recommendations. Videos with spiking traffic patterns give different CTR results at different times—what wins on day 1 might lose on day 5.
The fix
Run tests on videos with stable, predictable impressions over 7+ days, or test on community posts where traffic is more consistent. If your video gets 500 impressions on day 1 and 50 on day 7, that's a spike—wait for the next video with steadier performance.

Bias #2 — Sample Size Bias (Too Few Clicks)
The problem
Declaring a winner with fewer than 50 clicks per variant means you're measuring random chance, not real preference. A 10% CTR difference on 20 clicks (2 vs 4 clicks) is statistically meaningless—flip a coin 10 times and you might see 7 heads, but that doesn't mean the coin is biased.
The fix
Target 100+ clicks per variant minimum; 300+ gives you stronger confidence. If your video doesn't get enough traffic, test on a community post, wait longer (up to 7 days), or save the test for a higher-performing video.

Bias #3 — Timing Bias (Early Stopping)
The problem
Stopping after 24 hours when subscriber velocity is still high gives you day-1 CTR, not true CTR. Subscribers often click familiar-sounding titles (channel style) more than new viewers do, so early data skews toward whatever matches your existing voice.
The fix
Run tests for 48–72 hours minimum. The first 24 hours favor subscribers and notifications; days 2–3 reflect organic feed traffic. If your video gets steady impressions, wait the full 72 hours. If traffic is slow, extend to 7 days or test on a video with more traction next time.

Bias #4 — Confirmation Bias (Cherry-Picking Metrics)
The problem
When results don't match your hypothesis, it's tempting to switch success metrics mid-analysis. Title A wins on CTR but Title B has better watch time? Suddenly watch time becomes the "real" metric. This is cherry-picking, and it voids your test.
The fix
Define your primary success metric before the test starts. CTR, watch time, or conversions—pick one. Log all metrics so you can review them, but commit to judging winners on the metric you chose up front. If you want to test multiple goals, run separate experiments.
Bias #5 — Novelty Bias (Subscriber Preference)
The problem
Subscribers click titles that match your channel style because they recognize your voice. New viewers from feeds need clarity and specificity. If 80% of your test traffic comes from subscribers, you're measuring subscriber preference—not what works for discovery.
The fix
Weight external traffic separately, or test on community posts before the video goes live. YouTube Studio shows traffic source breakdowns—if subscriber clicks dominate, wait longer for organic feed traffic to balance the sample, or run a follow-up test on an evergreen video with consistent external impressions.

Bias #6 — Placement Bias (Unequal Visibility)
The problem
Placing Link A in description line 1 and Link B buried in "Show more" guarantees Link A gets more clicks—regardless of which title is actually better. Unequal visibility voids the test.
The fix
Place both links side-by-side with equal formatting—same font size, same prominence, both visible without expanding. Label them clearly (A/B or Option 1/2) and rotate order across tests to catch position bias (test "A then B" one time, "B then A" the next).

Bias #7 — Platform Bias (Cross-Platform Assumptions)
The problem
Assuming YouTube results apply to TikTok or Instagram is a mistake. YouTube favors specificity and benefit-led titles for long-form content. TikTok rewards curiosity and scroll-stopping hooks. Instagram varies by niche and content type (Reels vs carousel vs photo). The same title pair can produce opposite winners across platforms.
The fix
Run separate tests per platform. Validate hypotheses independently. If curiosity-led titles win on TikTok but lose on YouTube, that's a signal—not a flaw. Cross-platform patterns emerge over time, but don't assume transferability from a single test.

Checklist: Clean Test Design
Use this checklist to design bias-resistant tests. Follow all three phases—pre-test, during, and post-test—to catch biases before they invalidate your results.

Pre-Test
- Define clear hypothesis (e.g., "Curiosity beats benefit for this niche")
- Choose ONE primary success metric (CTR, watch time, or conversions—not all three)
- Set minimum sample size target (100+ clicks per variant minimum; 300+ ideal)
- Commit to test duration (48-72 hours minimum, 7 days max)
During Test
- Place tracking links side-by-side with equal formatting in description or pinned comment
- Verify both links are visible without "Show more" expansion
- Log ALL metrics (impressions, clicks, watch time, engagement) to prevent cherry-picking
- Resist early peeking—wait the full 48-72 hours before analyzing
Post-Test
- Check confidence intervals (aim for >95% confidence OR >2% absolute CTR difference)
- Review ALL logged metrics—not just the one that confirms your hypothesis
- Document learnings: What worked? What didn't? Why do you think that happened?
- If inconclusive (no clear winner), test thumbnail-title pairing next—not just title alone
Common Mistakes & Fixes
- Stopping after 24 hours → Wait 48-72 hours for stable data; early velocity isn't final CTR.
- Testing on videos with <500 impressions → Use high-traffic videos or community posts to get enough sample size.
- Unequal link placement → Place both links side-by-side with identical formatting and visibility.
- Ignoring confidence intervals → Aim for >95% confidence or >2% absolute CTR difference before calling a winner.
- Reusing the same test setup → Rotate link order (A then B, then B then A) to catch position bias.
FAQs
- How do I know if my sample size is big enough?
- Aim for 100+ clicks per variant minimum. Fewer than 50 is noise; 300+ gives you strong confidence. Use a confidence calculator or the Title A/B Tracker to check statistical significance.
- What confidence level should I aim for?
- Target >95% statistical confidence or >2% absolute CTR difference (e.g., 6% vs 8%). Lower confidence means you're likely measuring random variance, not real preference.
- Can I test titles and thumbnails at the same time?
- No. Testing two variables at once (title + thumbnail) makes it impossible to know which one drove the difference. Test one variable per experiment. If you want to test pairings, run separate tests or use a factorial design with 4+ variants.
- How long should I wait before analyzing results?
- Minimum 48-72 hours. Aim for 100+ clicks per variant or 7 days max, whichever comes first. Early stopping (24h) captures subscriber velocity, not organic CTR.
- What if my video gets inconsistent traffic?
- Test on videos with stable impressions over 7+ days, or use community posts where traffic is more predictable. Spiking traffic (day 1 surge, then drop) introduces variability that skews results.
- Should I test on new videos or existing ones?
- Both work. New videos let you test launch velocity and subscriber preference; existing videos with steady organic traffic give cleaner ongoing CTR. For less bias, prefer videos with consistent external traffic.
- How do I avoid confirmation bias when results are close?
- Define your success metric and minimum confidence threshold before the test starts. If neither variant hits your threshold (e.g., >95% confidence), call it inconclusive and test something else—don't switch metrics mid-analysis to find a winner.